The following was presented at the College of Applied Biology’s annual conference Evidence Matters: Professional Practice in a Post-Truth World in Victoria, BC on March 3rd 2015. It is also provided below with additional text.
Using P-Values with Confidence
Background
The p-value is perhaps the most ubiquitous statistical index.
It is also the most
misunderstood,
and/or misused,
and/or misaligned
depending on whom you ask.
American Statistical Association
Wasserstein, R.L., and Lazar, N.A. 2016. The ASA’s Statement on P-Values: Context, Process, and Purpose. The American Statistician 70(2): 129–133.
What is a p-value?
A p-value of <0.05 indicates that the 95% confidence interval excludes 0.
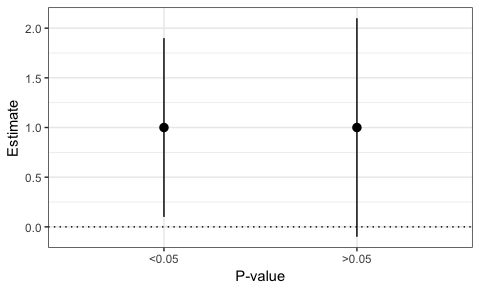
What is the utility of a p-value?
P-values are useful because they indicate the confidence with which we can exclude 0.
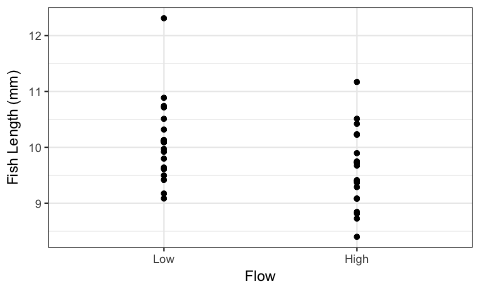
T-Test
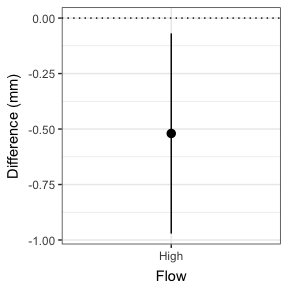
model <- lm(Length~Flow, data = data)
round(summary(model)$coefficients,4)
## Estimate Std. Error t value Pr(>|t|)
## (Intercept) 10.1079 0.1576 64.1487 0.000
## FlowHigh -0.5200 0.2228 -2.3336 0.025Principle 1
1. P-values can indicate how incompatible the data are with a specified statistical model.
A p-value, or statistical significance, does not measure the size of an effect or the importance of a result.
Scientific conclusions and business or policy decisions should not be based only on whether a p-value passes a specific threshold.
Proper inference requires full reporting and transparency.
P-values do not measure the probability that the studied hypothesis is true, or the probability that the data were produced by random chance alone.
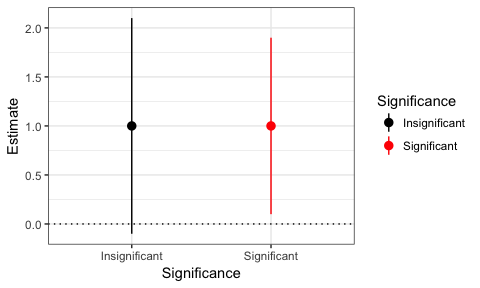
Significance
In biology p-values of <0.05 are generally considered to be significant.
The End
Conclusion
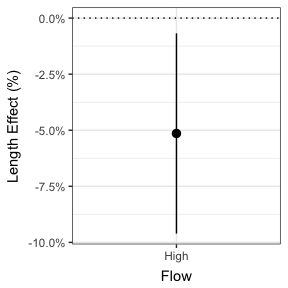
Flow is a significant predictor of fish length.
Appendix
##             Estimate Std. Error t value Pr(>|t|)
## (Intercept)   10.108      0.158  64.149    0.000
## FlowHigh      -0.520      0.223  -2.334    0.025
Principle 2
- P-values can indicate how incompatible the data are with a specified statistical model.
2. A p-value, or statistical significance, does not measure the size of an effect or the importance of a result.
Scientific conclusions and business or policy decisions should not be based only on whether a p-value passes a specific threshold.
Proper inference requires full reporting and transparency.
P-values do not measure the probability that the studied hypothesis is true, or the probability that the data were produced by random chance alone.
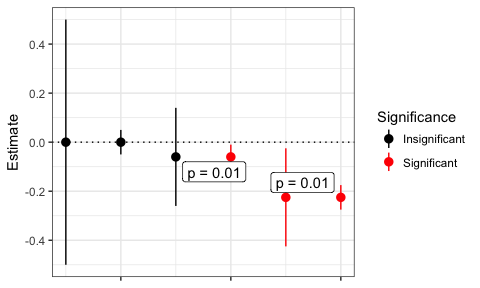
A Limitation
p = 1
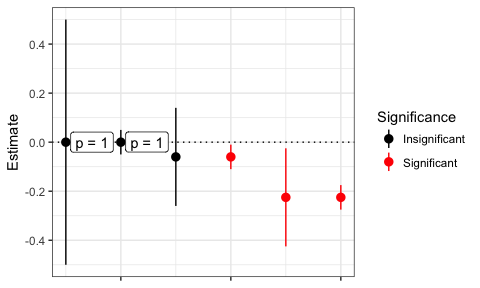
p = 0.01
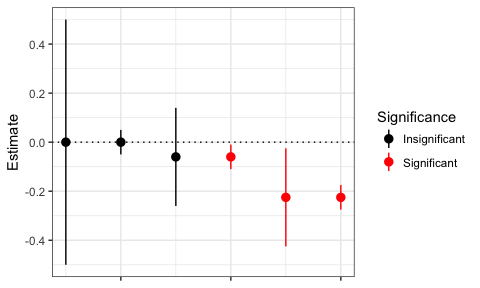
Biological Importance
Principle 3
P-values can indicate how incompatible the data are with a specified statistical model.
A p-value, or statistical significance, does not measure the size of an effect or the importance of a result.
3. Scientific conclusions and business or policy decisions should not be based only on whether a p-value passes a specific threshold.
Proper inference requires full reporting and transparency.
P-values do not measure the probability that the studied hypothesis is true, or the probability that the data were produced by random chance alone.
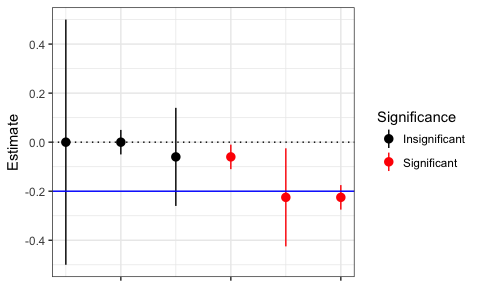
Confidence Interval
Effects Size
Principle 4
P-values can indicate how incompatible the data are with a specified statistical model.
A p-value, or statistical significance, does not measure the size of an effect or the importance of a result.
Scientific conclusions and business or policy decisions should not be based only on whether a p-value passes a specific threshold.
4. Proper inference requires full reporting and transparency.
- P-values do not measure the probability that the studied hypothesis is true, or the probability that the data were produced by random chance alone.
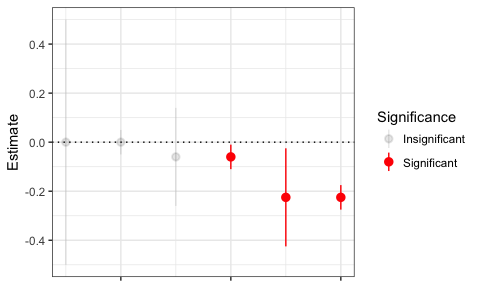
P-Hacking
Principle 5
P-values can indicate how incompatible the data are with a specified statistical model.
A p-value, or statistical significance, does not measure the size of an effect or the importance of a result.
Scientific conclusions and business or policy decisions should not be based only on whether a p-value passes a specific threshold.
Proper inference requires full reporting and transparency.
5. P-values do not measure the probability that the studied hypothesis is true, or the probability that the data were produced by random chance alone.
Conditional Probability
Much of the additional confusion around p-values stems from the fact that frequentist methods make statements about data in relation to a model.
However, intuitively what we actually want are (Bayesian) statements about models in relation to the data.
Conclusions
Use p-values with confidence intervals.
Express confidence intervals as effects sizes.
Discuss biological importance.
Don’t p-hack.
Further Reading
Gardner, M.J., and Altman, D.G. 1986. Confidence intervals rather than P values: estimation rather than hypothesis testing. BMJ 292(6522): 746–750. doi:10.1136/bmj.292.6522.746.
Greenland, S., and Poole, C. 2013. Living with P Values: Resurrecting a Bayesian Perspective on Frequentist Statistics. Epidemiology 24(1): 62–68. doi:10.1097/EDE.0b013e3182785741.